 TraderTile
Keep the context.
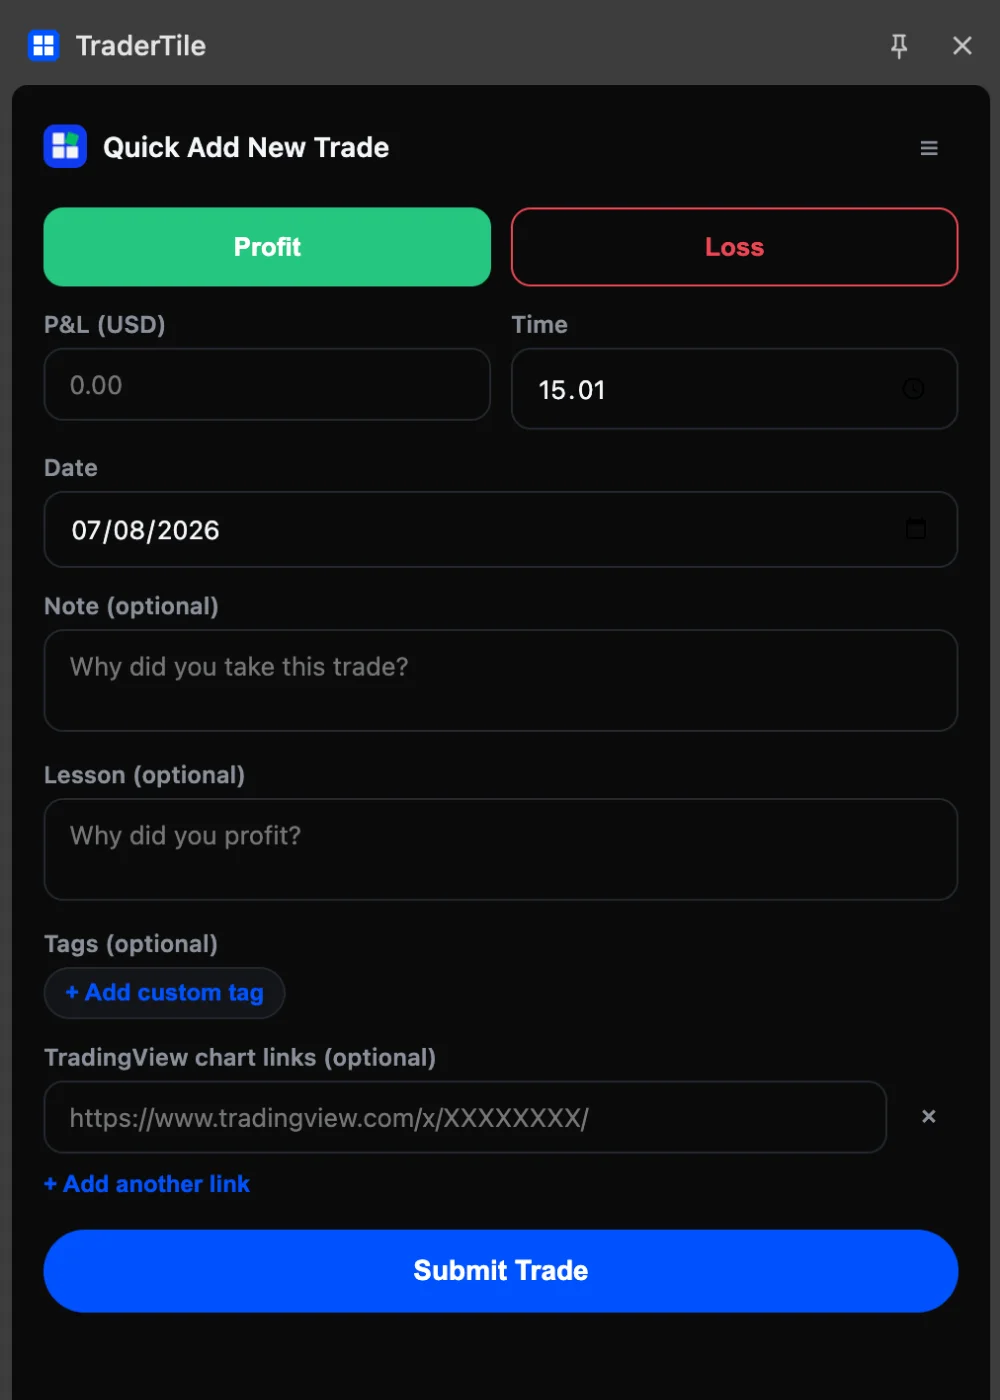
Log your result while the trade is fresh. Add a note, a setup tag and a TradingView chart link.
Your trading journal, from the first entry to the monthly recap. See your P&L, understand your setups, and put your progress in perspective.
Free forever plan · No card required · Local-first
A little reflection goes a long way
A journal should help you connect the dots. From the trade you just closed to the patterns across your month.
Log your result while the trade is fresh. Add a note, a setup tag and a TradingView chart link.
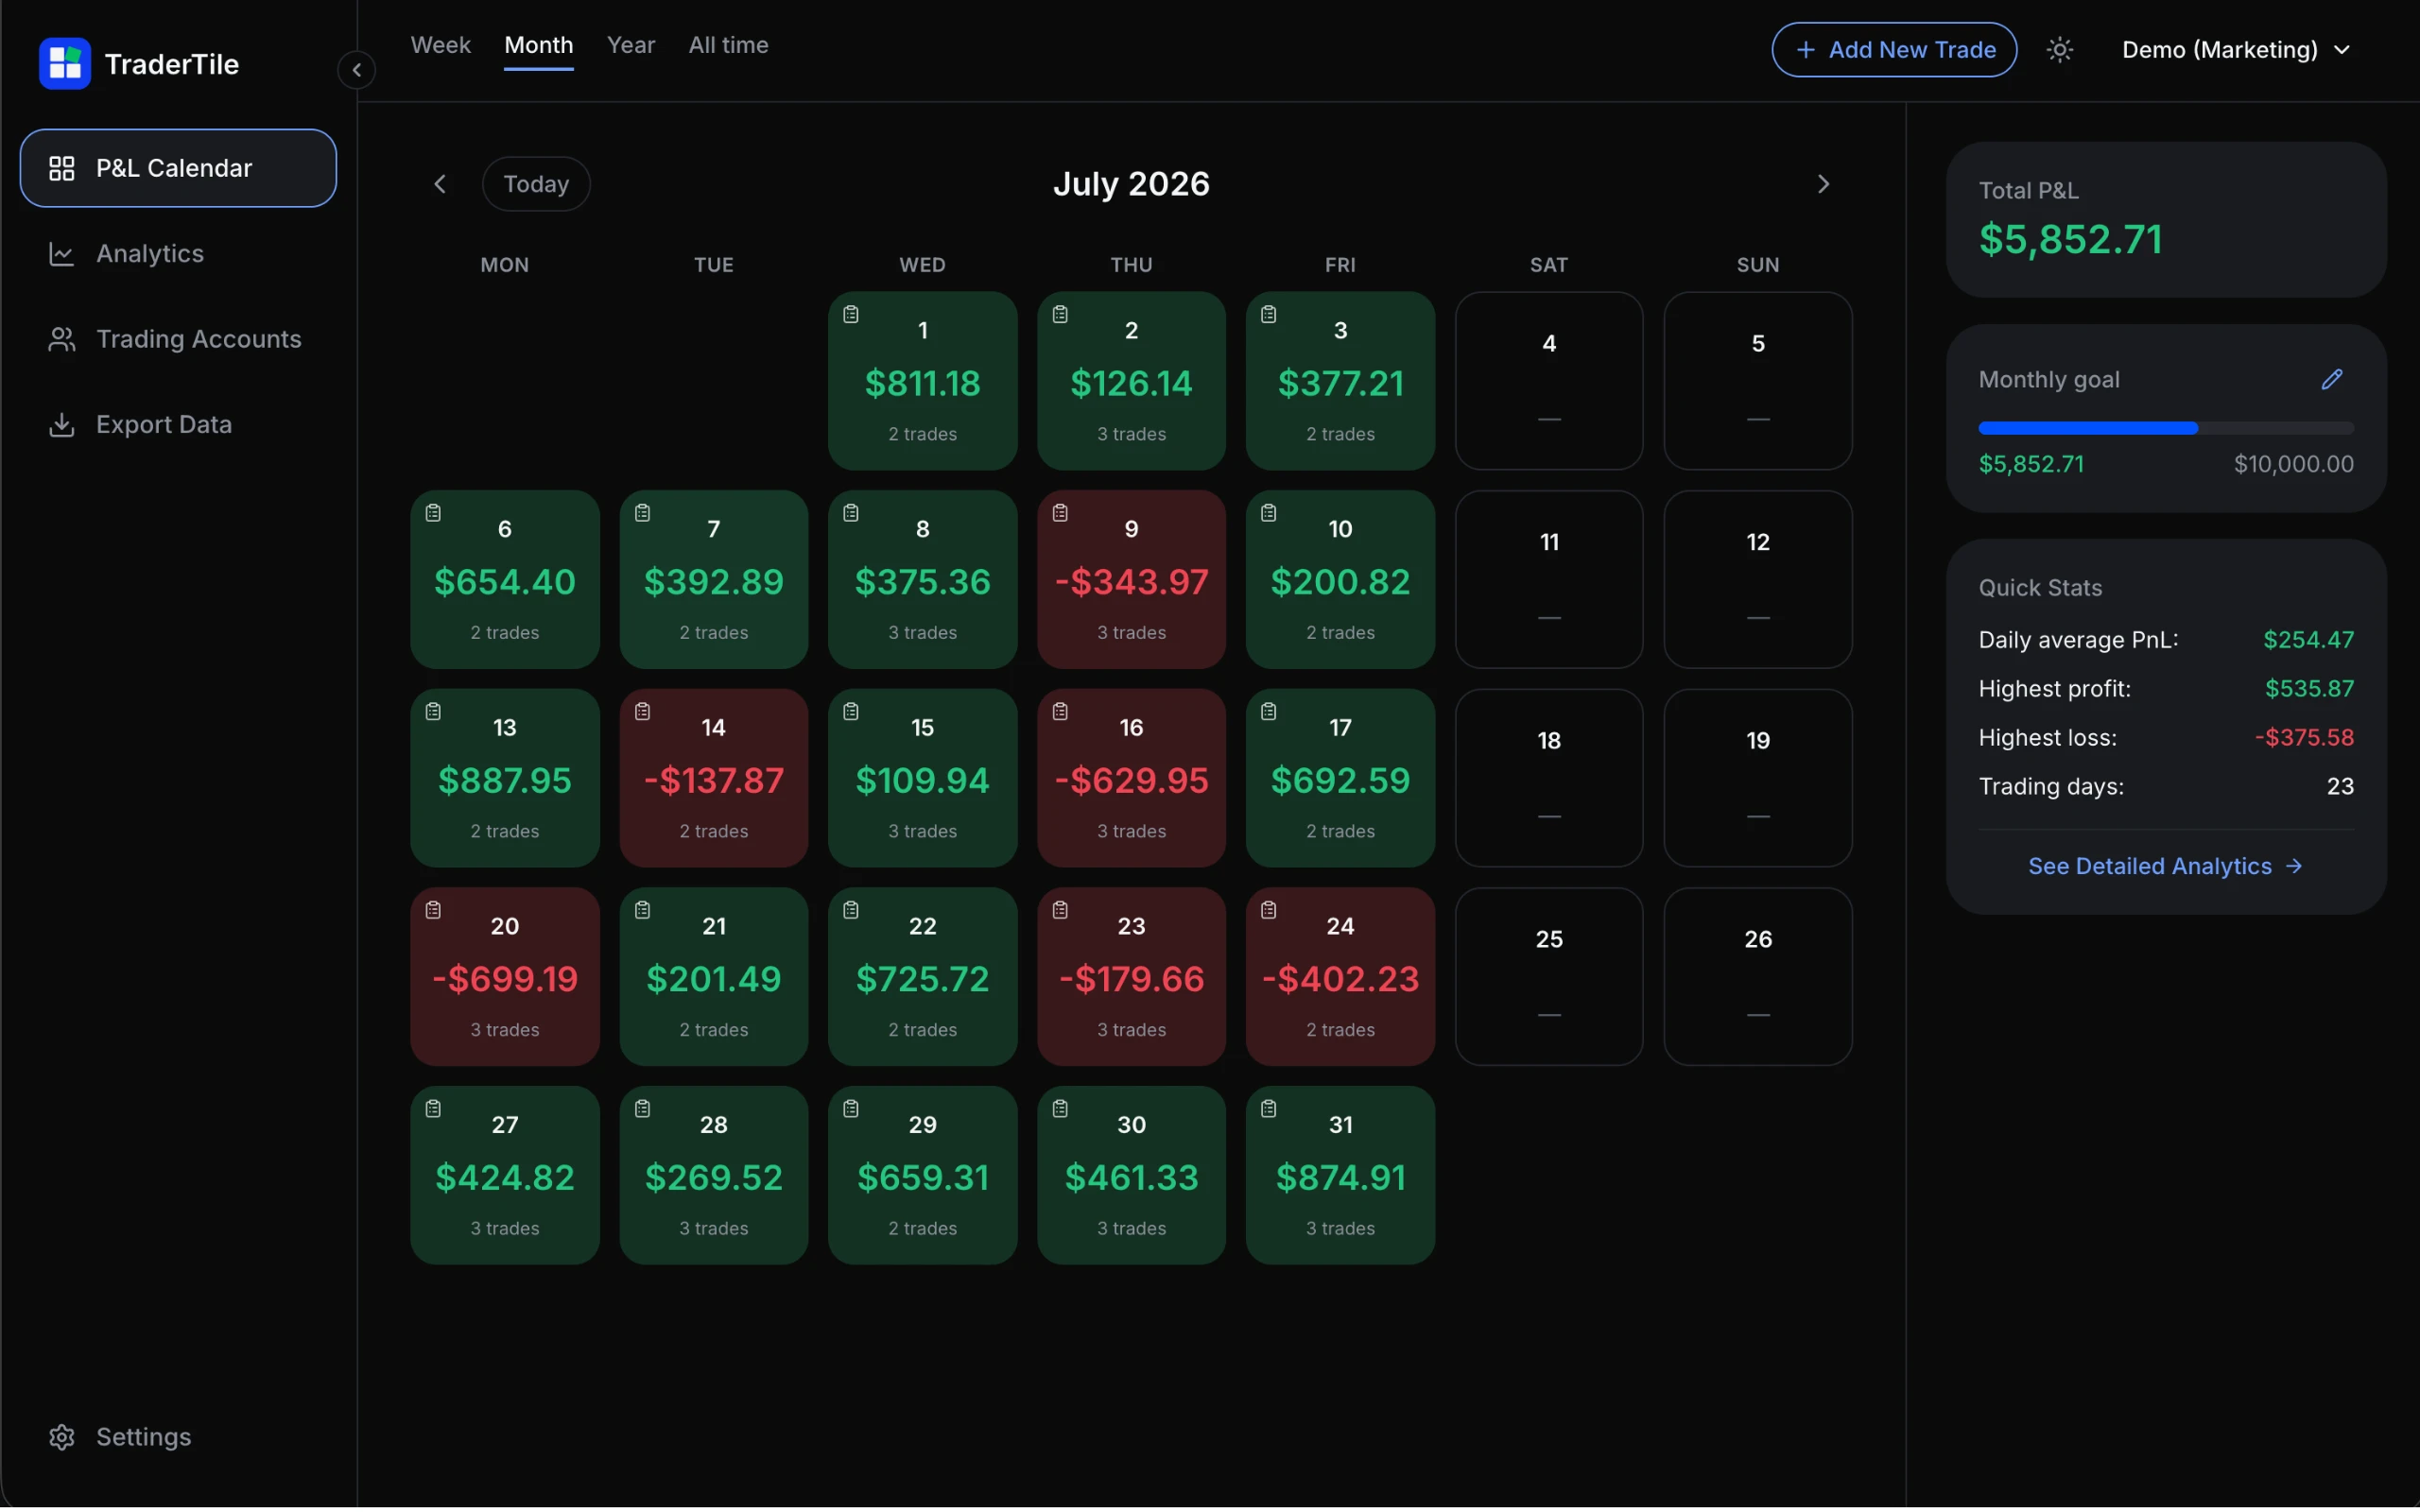
Move from daily P&L tiles to your monthly picture. Explore the setups and sessions behind your results.
Choose the numbers you want to show. Turn your trading month into a recap you can save or share.
Monthly recap
A finished recap, straight from your journal. Pick your layout, choose your metrics, add your username. Ready for your feed, your story, or just yourself.

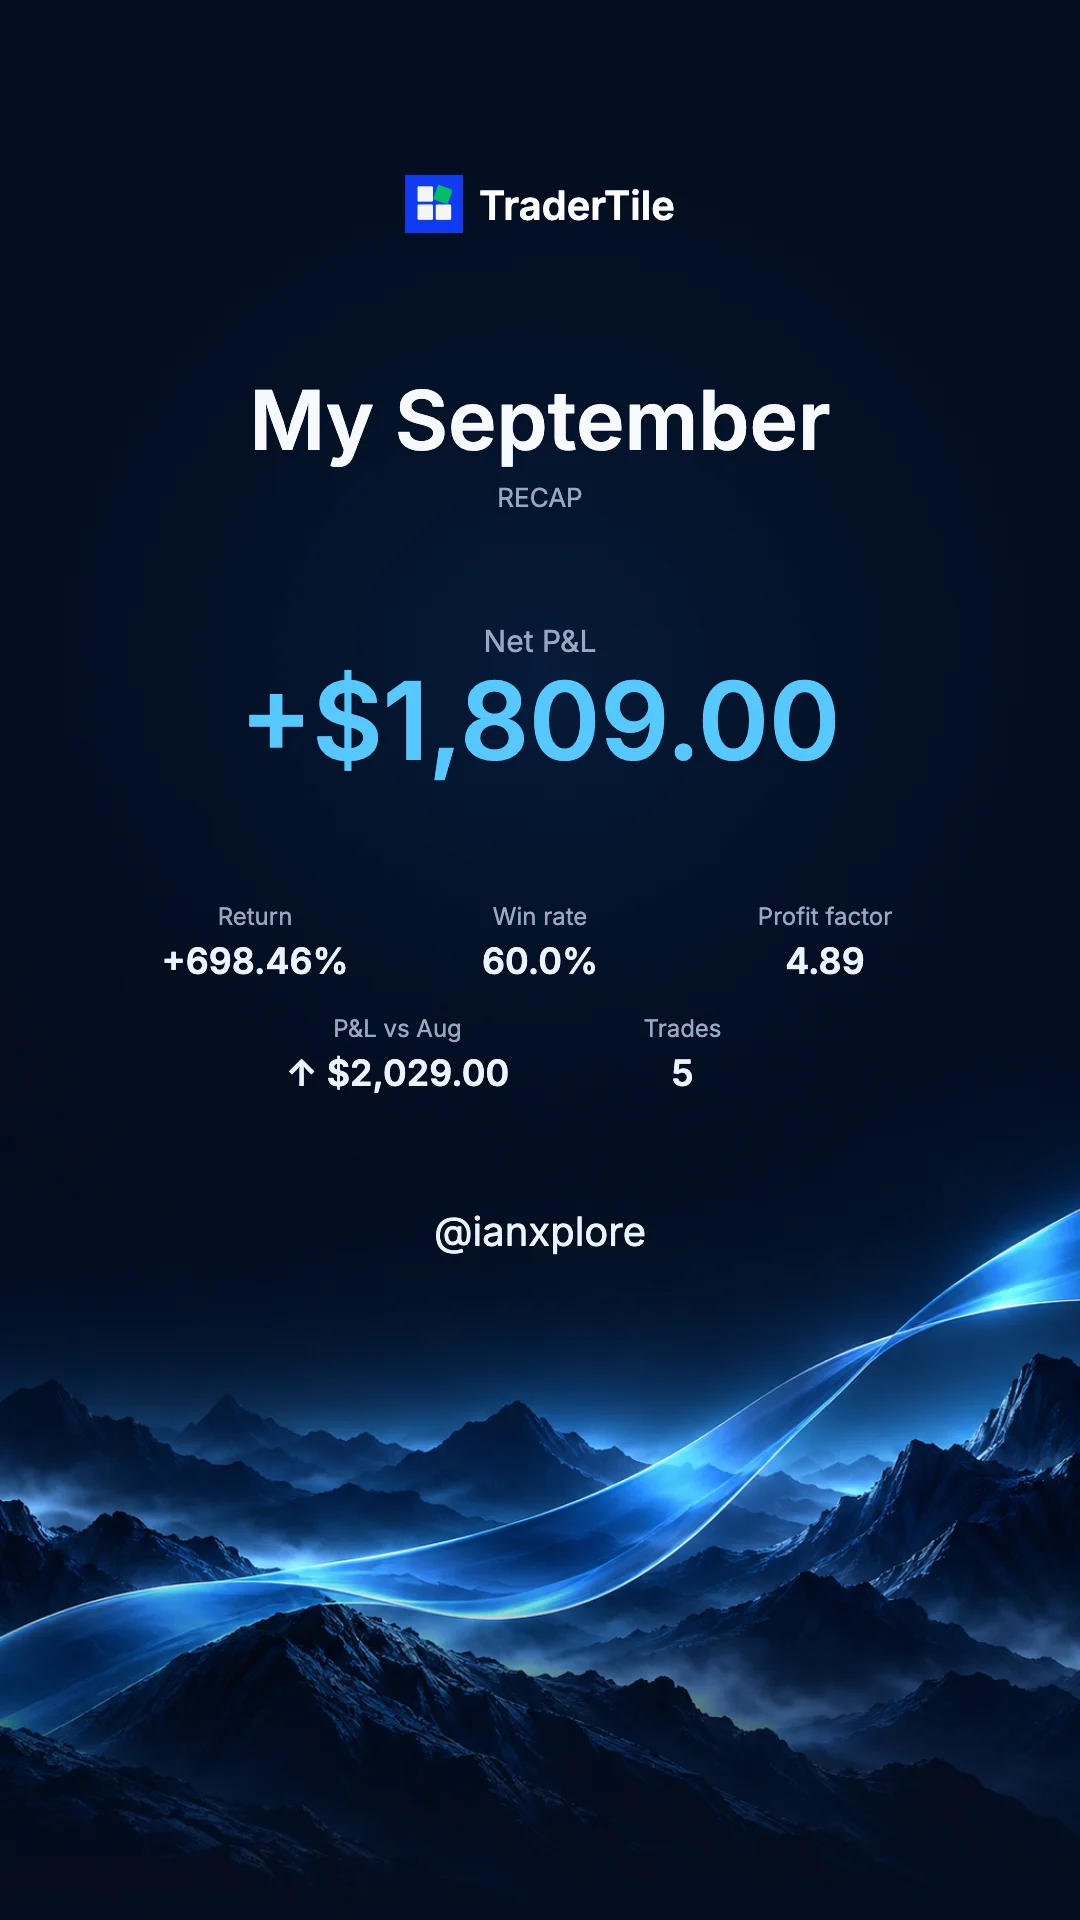
Example recap supplied by @ianxplore. Results shown are individual, not expected returns.
PNG export Your choice of metricsPremium unlocks return, win rate, profit factor and month-to-month comparison in your recap.
Go beyond the green and red
MONTHLY ANALYTICS · PREMIUM
Put net P&L in context with monthly return, period comparisons and realized drawdown. Set a starting balance for each month to see your return.
SETUP & RISK ANALYTICS · PREMIUM
Turn trade notes into consistent tags, then review performance by setup and session. Add initial risk to your trades to measure expectancy in R.
MT5 IMPORT
Import an MT5 Trade History Report (.xlsx) into a Forex account. Set your broker’s timezone, preview the trades and review potential duplicates before saving.
P&L calendar · Multiple accounts · TradingView chart links · CSV & PDF export
 Stay in your trading flow.
Chrome side panel + Tilt Guard
Open TraderTile beside your chart and record the trade without switching tabs. Your active account stays visible, so every entry lands in the right journal.
Start with the next trade
Your journal starts free, with unlimited local trades.
Go Premium when you want deeper analytics and cloud sync.
PREMIUM
Or $49 once for Lifetime.
Yes. The free plan includes unlimited local trades, the P&L calendar, drawdown chart, multiple accounts and CSV/PDF export. There is no time limit and no card required. Premium adds deeper analytics and cloud sync.
Choose portrait or landscape, select the available metrics and add your username. Download a PNG or share it directly on supported devices. Premium unlocks analytics fields such as return, win rate, profit factor and the comparison with the previous month.
No. Log trades manually, use the Chrome side panel, or import an MT5 XLSX report into a Forex account. TraderTile does not need your broker credentials or API keys.
Your journal is stored locally in your browser. Premium adds cloud backup and sync across devices. Export your trades to CSV or PDF whenever you need them.